The Project
The Gospel Data project is part of my ongoing investigation of the Synoptic Gospels
and their literary relationship.
This website is, in one instance, my final project for DIGS 30005 - Data Publication, where I display my knowledge and implementation of resources for digital publication such as, HTML, CSS, JavaScript, jQuery, XML, and XSL.
In another, it serves as a sort of "digital appendix" to my Master's Thesis at the University of Chicago entitled "Gospel Data: The Utility of Empirical Analyses of the Synoptics Gospels seen through an Exegesis of the Healing of the Paralytic." In this regard I hope to use this website to display my notes on the Synoptic texts and highlight the ways in which they can be analyzed.
Lastly, I hope this website will become a resource for others who study to Synoptic Gospels. To this end I envision it as a starting point for discussion on how these texts can be analyzed in new ways, and what questions can be investigated when engaging with the texts in a digital medium.
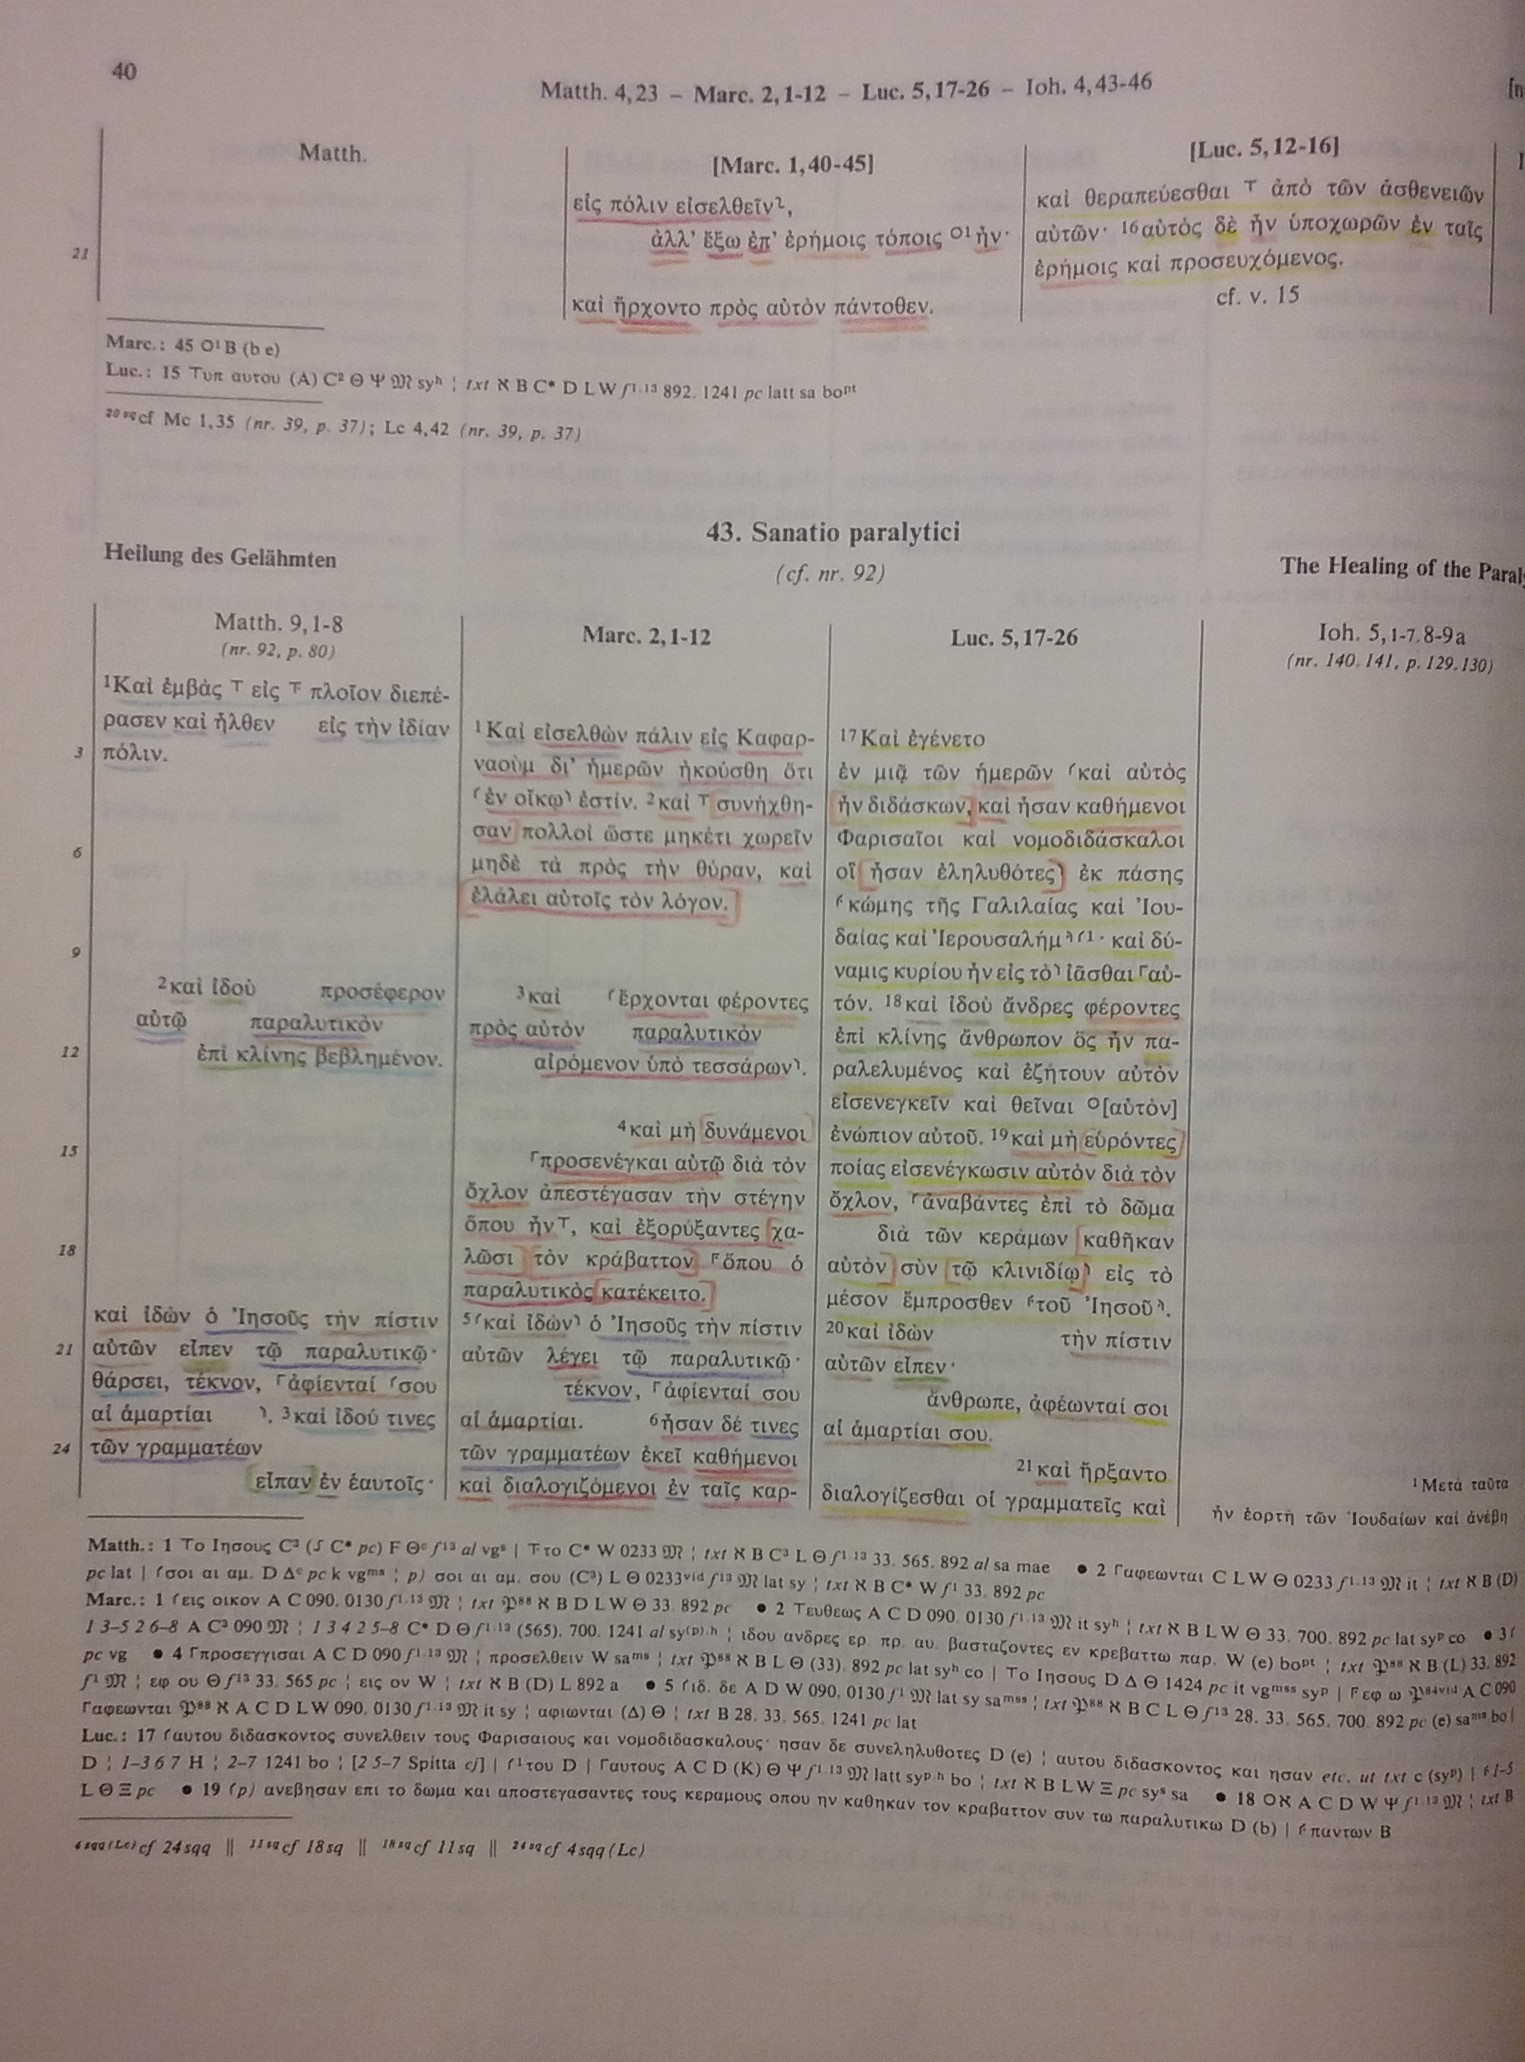
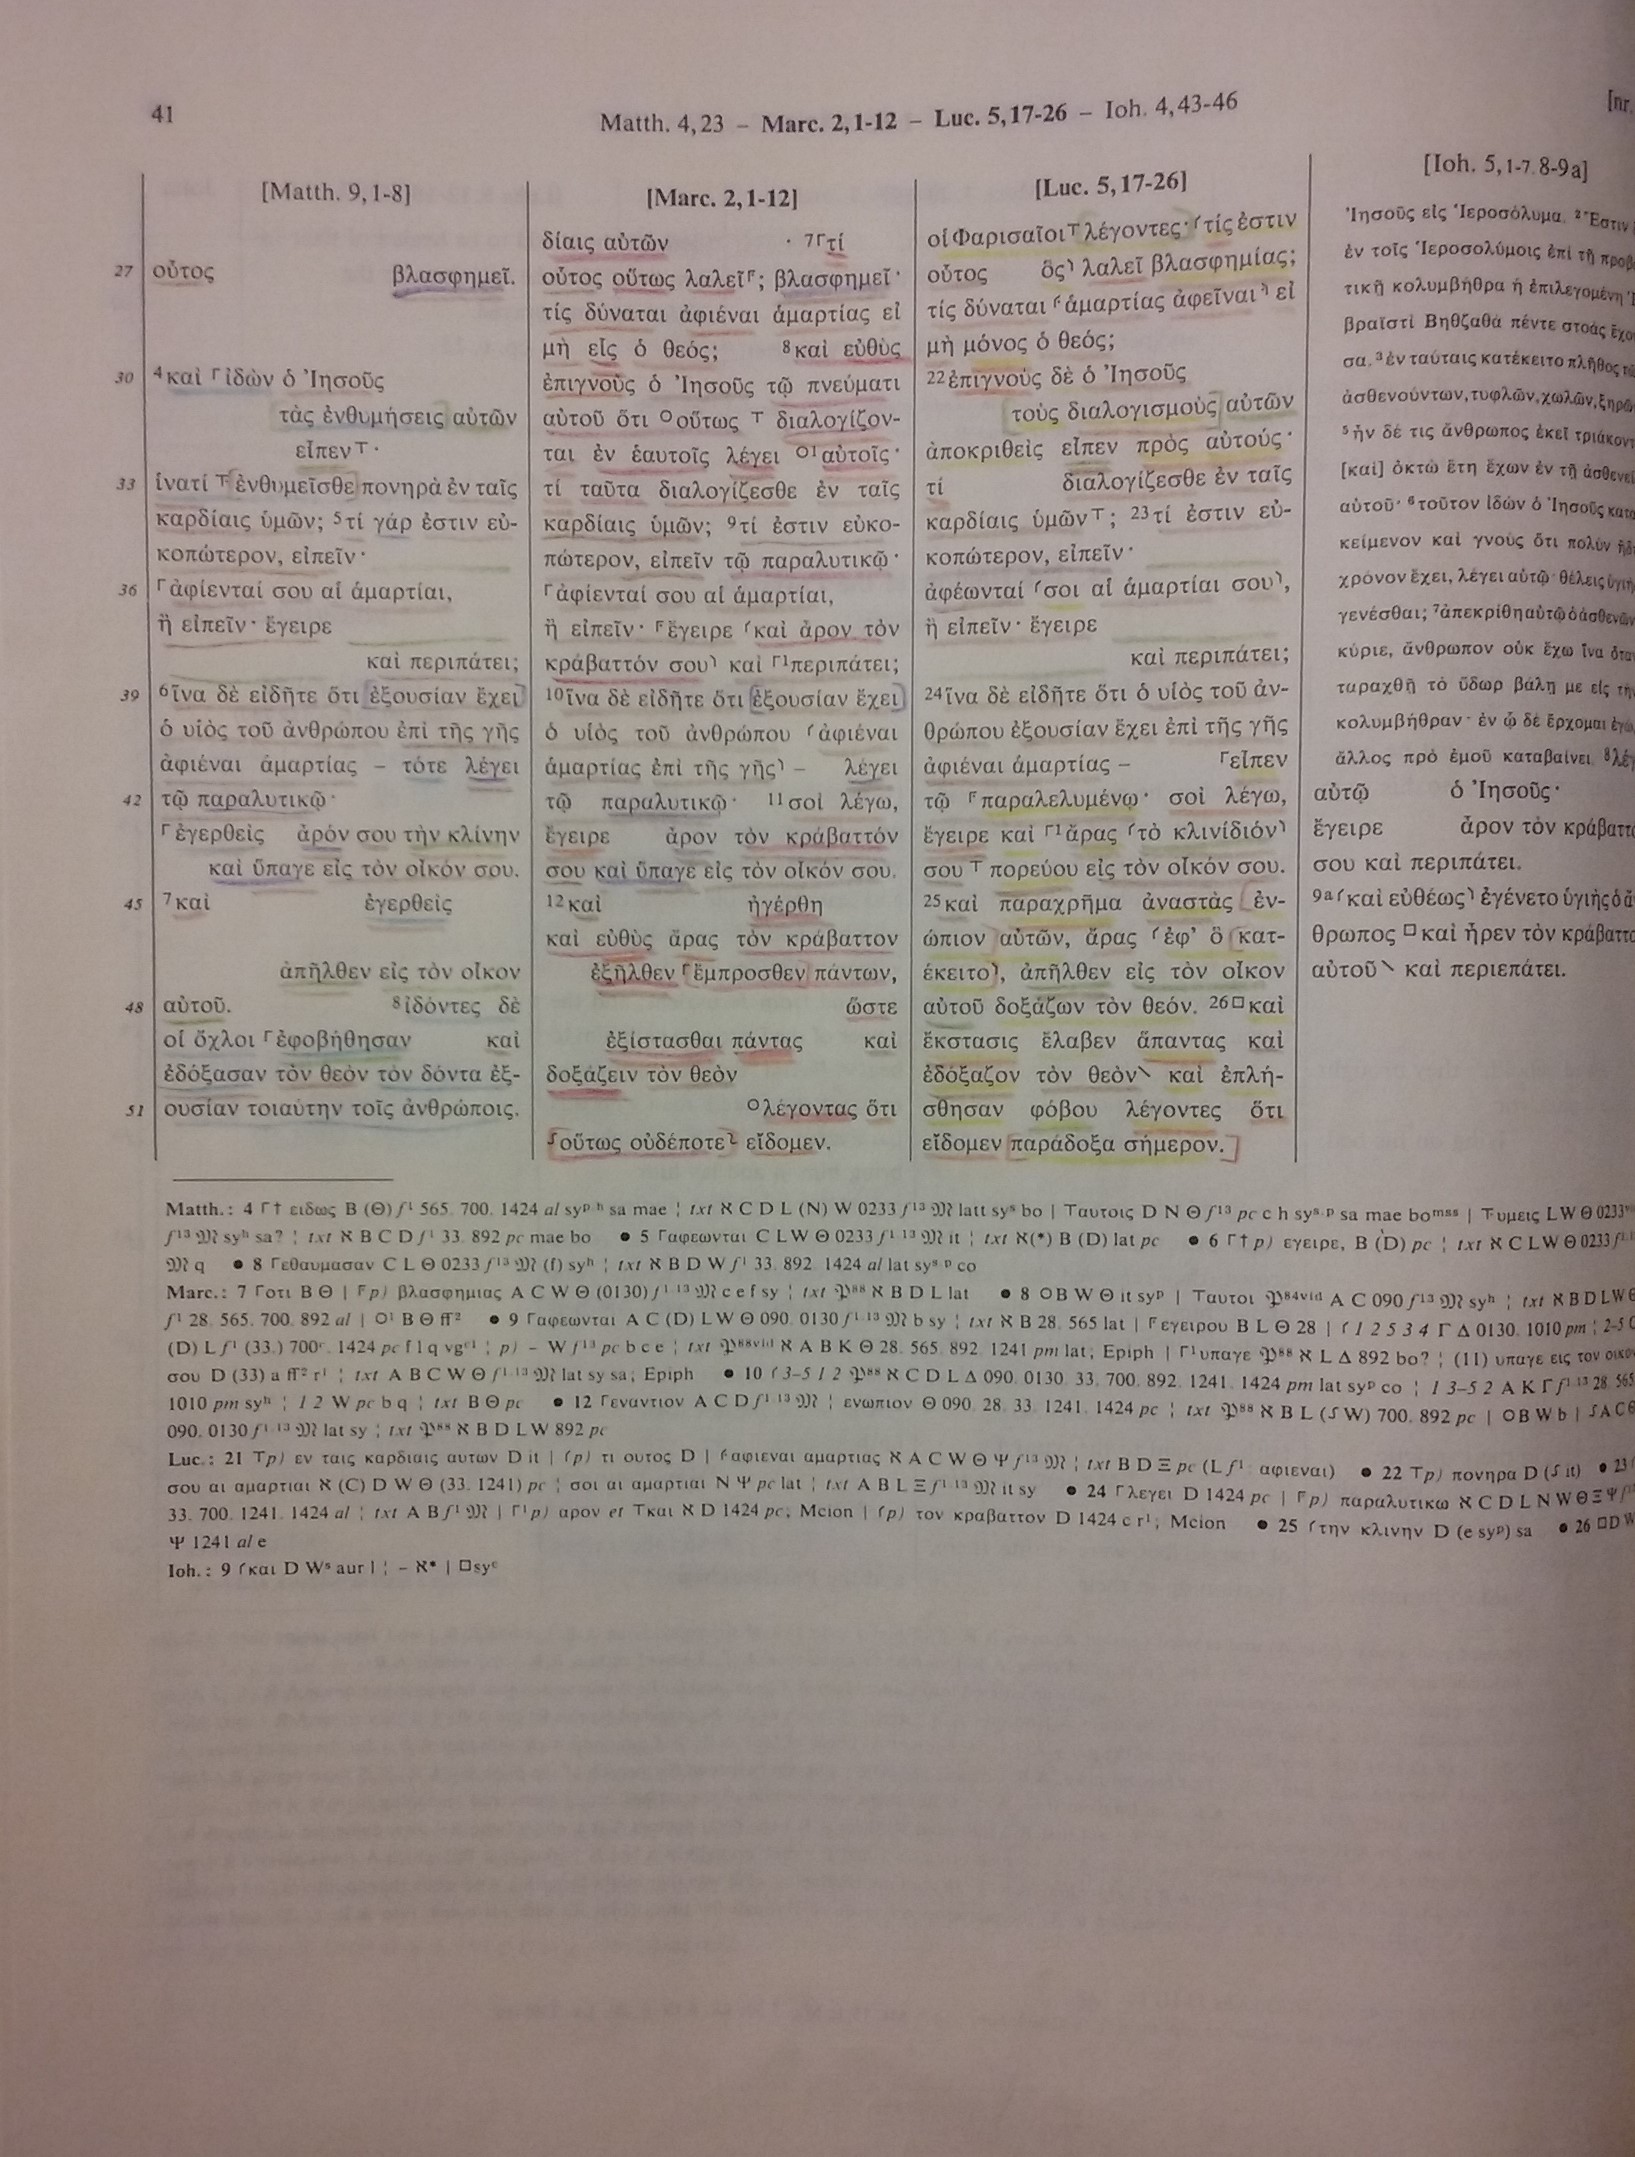
The main goal of this project is to turn my notes on agreements between the
Synoptic Gospels into a digital form. In short, how to turn my color coded synposes, like this one
on the Healing of the Paralytic, into something interactive that can be viewed and used by others.
For many years, the tried and true method of studying the Synoptic Gospels has been to sit
down with a synopsis and go through the parallel texts. This website is no different. What it adds is the ability
to manipulate how you view the synopses, in particularly the colors you used to compare the texts.
The colors one uses when highlighting a synopsis can vary greatly, so I have tried to provide as much flexibility as possible when it comes to choosing a color scheme for viewing the synopses.
My personal choice of color scheme is what I call the "Primary Scheme" because it makes use of the three primary colors, blue, red, and yellow, to represent the three Synoptic Gospels, Matthew, Mark, and Luke, respectively. By mixing the primary colors one can create any other color, which in the synopses corresponds to "mixing" the three gospels.
Matthew + Mark = Blue + Red = Purple
Matthew + Luke = Blue + Yellow = Green
Mark + Luke = Red + Yellow = Orange
Right now the synopses display two types of agreement. The first is agreement in form. This
means the word has the same morphology between two or more texts. For example, εἶπεν and εἶπεν, but not εἶπεν and λέγει.
The second is agreement in lemma. This means the word matches the dictionary entry of another, even if its morphology in the text differs. For example, εἶπεν and λέγει both have the dictionary entry of λέγω.
The second is agreement in lemma. This means the word matches the dictionary entry of another, even if its morphology in the text differs. For example, εἶπεν and λέγει both have the dictionary entry of λέγω.
As of now, the synopses follow the text as it appears in the NA28. However, because
variants are important to understanding an agreement between a Synoptic text, I hope to implement the ability
to select variants from the critical apparatus in the near future. Please be patient as I figure out how
best to code this complicated set of data.
All the information for the synopses lives in a SQL database I am constructing.
The goal of this project is to deliver that data to a web browser. There are several ways to go about this
and I have chosen to do the following:
- Using existing treebanking data from the PROIEL Treebank and BibleWorks10 I compile this data into a SQL database.
- I then transform the SQL database into an XML document of synoptic pericopae
- Using an XSL stylesheet I transform the XML catalogue into an HTML document.
Sources and References
For a complete overview on how to use and understand the synopses, please read
the user guide.
This website makes use of the 15th edition of the
Synopsis Quattuor Evangeliorum.
It uses the same titles and numbers for each pericope. However, it does not always display the same verse divisions.
It uses the same titles and numbers for each pericope. However, it does not always display the same verse divisions.
This website makes us of the 28th edition of the
Novum Testamentum Graece.
The text and parsing tags are included from BibleWorks 10.
The text and parsing tags are included from BibleWorks 10.